
Client side script code means that it can be VB Script or J# script or Java script.
Client side script is embedded in .aspx pages, .html files or inside .js files.
Generally, client side script is loaded by client application like Internet Explorer running on your local machine.
There are two different ways in which can debug client side scripts in Visual Studio 2005. They are:
Visual Studio .Net IDE
Microsoft Script Editor
Configuring machine to enable client side script debugging
Before we start to debug client side script code, certain settings have to be made like this:
Enable client side script debugging in Internet Explorer.
To do this go to Tools ->Internet Options and on advanced tab make sure that the Disable script debugging is unchecked. Below listing highlights above step
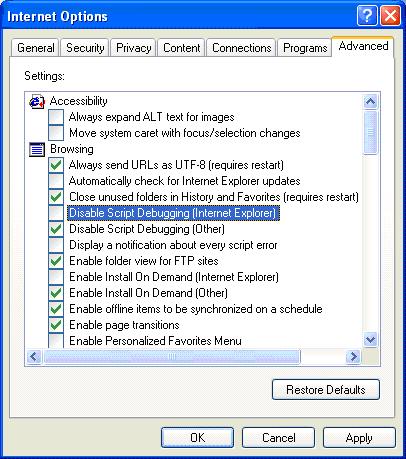
Enable Script Debugging in IE
Visual Studio .Net IDE
You can now debug client side script code directly in Visual Studio 2005 environment.
It is made possible through powerful debugging options that enable you to debug managed code, script code, T-SQL code, and native code.
Visual studio 2005 supports 64-bit debugging either locally or remotely.
You can now debug Java scripts hosted by IE. Visual studio debugger provides enhanced new features like data tips,
visualizers which allow us to view contents of complex variables and data types in a meaningful way.
Let's see new capabilities using an
example Visual Studio 2005 project.
We create an ASP.NET web application that greets the user. We use Java Script for processing the result.
Open Visual Studio 2005 Environment and On the File menu, and open sample project for this tutorial
Press F5 (Start Debugging) to start debugging.
IEXPLORE.EXE process is attached automatically to debugger. We are using IE to load the scripts so IEXPLORE.EXE is attached.
<script
language ="javascript"
type="text/javascript">
function btnGreeting_Clicked()
{
debugger;
var firstname;
var lastname;
var greeting;
firstname = document.all('txtName1').value;
lastname = document.all('txtName2').value;
greeting = "Hai" +
" "+ firstname + " " + lastname +
" " + "Have a great
Day!";
alert(greeting);
return false;
}
</script>
Code listing above shows javascript function included in sample ASP.NET page.
You should always include keyword "debugger" as the first line of Java script code you wish to debug in Visual studio 2005.
This keyword automatically invokes Visual Studio client side debugger.
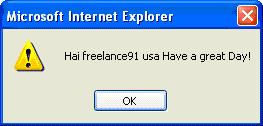
Once we run above code, we get the below output.
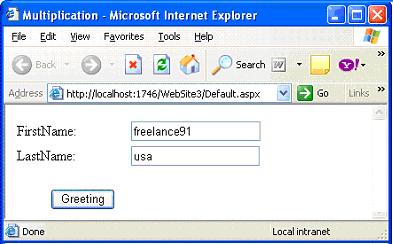
Output listing for greeting program
Return to Visual Studio .Net environment and click Debug ->Other windows->Script Explorer and set the breakpoints at the desired places.
Again return back to IE. Give the values for the first name and last name and click greeting button.
You can see control returning to Script Explorer as shown in below listing.
Use F10 to step over each line of code. Similarly, use F11 to step into each line of code.
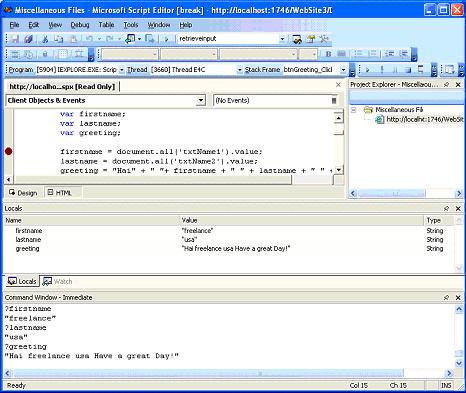
In script explorer, you can set new breakpoints and use Locals Window to inspect values of local variables in the script.
Immediate Window evaluates the values of variables. See the Data tips by hovering over the variables.
To invoke Immediate Window click Debug->windows->Immediate. Similarly Locals Window is invoked via click Debug->windows->Locals
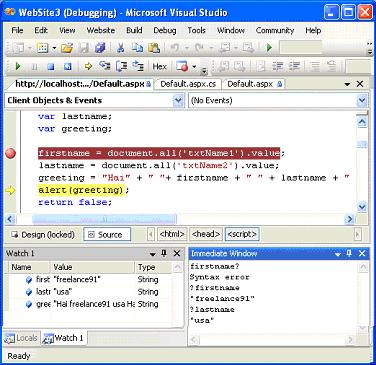
Script Explorer in Action
You can also use Command Window to execute commands against script code variables like Debug.print command.
To invoke Command Window click->View->Other Windows->Command Window.
Several other features like Autos Window, Call Stack Window are also accessible. You can observe Command Window in below listing
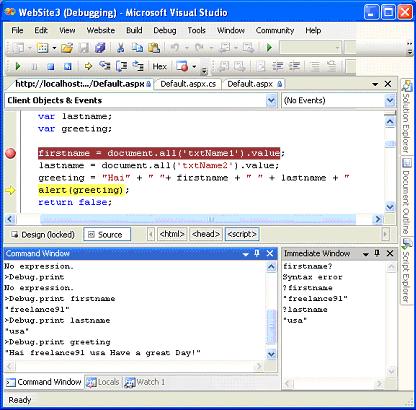
Script Explorer in action
Microsoft Script Editor
Microsoft Script Editor (MSE) is powerful tool which debugs Java scripts using Internet Explorer as script host.
It is shipped as free component in Office XP and Office 2003.
This is an attractive option when all that you need is to debug Java scripts for IE and you don't have Visual studio .Net installed on your machine.
You can check for MSE in your machine by clicking View option on IE and see if you can find script debugger option.
Let's use same example to demonstrate debugging client side script code using MSE.
Going with the same example, Open the page in Internet Explorer and click View as shown in below listing.
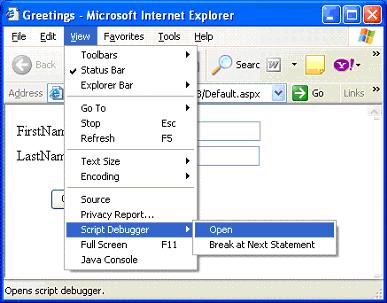
IE with MSE
After clicking Open /Break at Next Statement you can see Just-In-Time Debugger dialog box
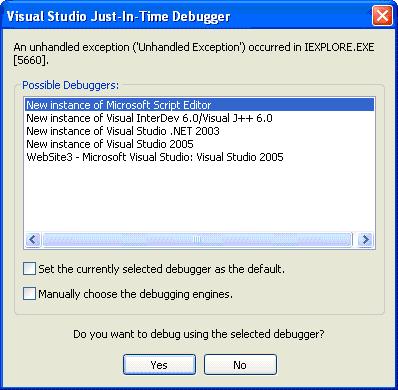
Click yes to use MSE and you can see below listed dialog box.
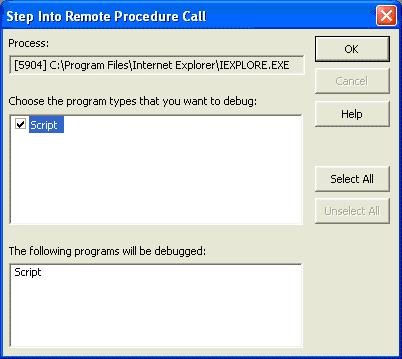
Click Ok and you can see Microsoft Script Editor Environment open up and MSE offers almost same IDE as Visual studio.Net
and similar others features like Locals Window and Command Window. You can use same F10 to step over code.
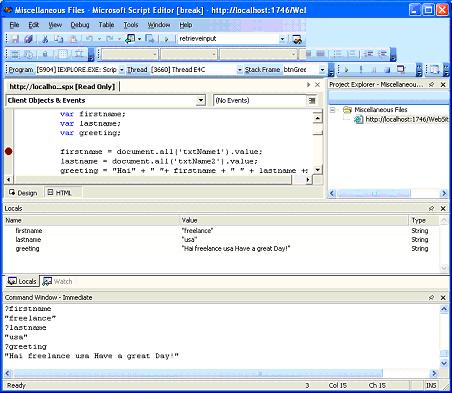
Microsoft Script Editor IDE
Alternatively, you can also use put a line like this in Java script.
Debugger;
Debugger keyword will create a breakpoint. When this breakpoint gets hit, your MSE will launch and you will see a message that
says "An unhandled exception 'Script Breakpoint' occurred" in script.
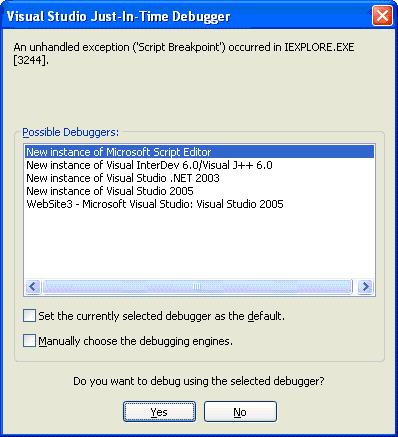
Just-In-Time Debugger
Choose yes and remaining steps are same as discussed in first method of working with MSE. Control is transferred to Script Editor IDE.
Microsoft Script Editor IDE
Finally you get after successful debugging you get this message as output.
When you are done debugging make sure the browser is not waiting for debugger.
Simply press F5 to continue or else explicitly close the debugger. Click "Yes" when it prompts to close debugger.
This way you can save from computer hang up. (It happened to me!!) When using MSE.
Visual Studio 2005 Integrated debugger is very powerful and rich in features.
You can now debug client side script code with the same flexibility as you used to have with debugging server side code.
You can say good bye to clumsy alert statement technique employed in Java script debugging.
Microsoft Script Editor is another attractive option for debugging with no fewer features compared to Visual studio 2005 debugger.


0 comments:
Post a Comment